CSC V.1 Chapter7 notes
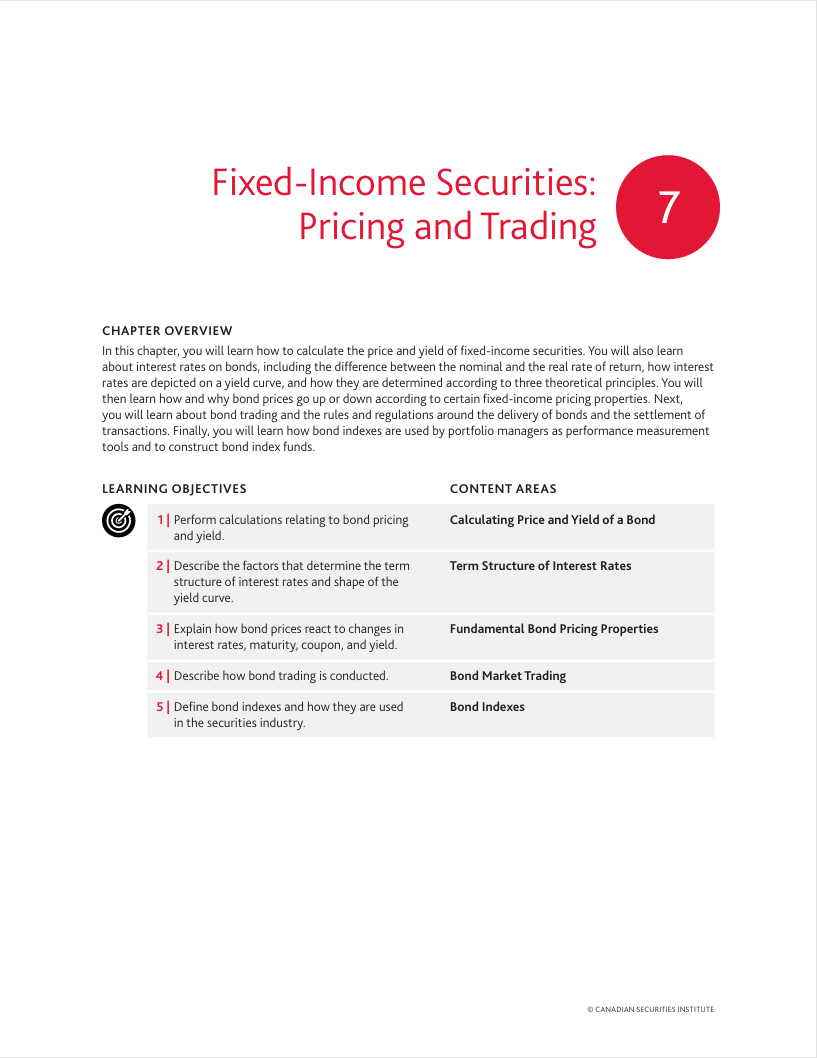
FIXED INCOME SECURITIES: PRICING AND TRADING
CALCULATING PRICE AND YIELD
- The most accurate method of determining the value of a bond is its present value. When you purchase a bond, you know the future receipts – interest payments and principal. An investor must determine what they are presently worth
- To determine the present value, an appropriate discount rate must be applied to the future cash flows. The discount rate is, effectively, the rate of return required by an investor
- There are four steps in calculating a bond’s present value:
- Choose the appropriate discount rate
- Calculate the present value of the income stream from the bond’s coupon payments
- Calculate the present value of the bond’s principal
- Add the present value of the coupon payments and principal
PRESENT VALUE CALCULATION
- A 6% semi-annual pay bond has two years to maturity. What is its present value assuming an investor has a i) 5% discount rate and ii) 8% discount rate?
- This bond would have the following cash flows:
$3 in six months’ time (first cash flow)
$3 in twelve months’ time (second cash flow)
$3 in eighteen months’ time (third cash flow)
$103 in twenty-four months’ time (fourth cash flow) - Because the bonds pay interest semi-annually, the discount rate must also be adjusted for semi-annual. Therefore, you would discount the cash flows by the following factors: (1.025)1 & (1.025)2 & (1.025)3 & (1.025)4 for the 5% factor and (1.04)1 & (1.04)2 & (1.04)3 & (1.04)4 for the 8% factor
CALCULATOR KEYSTROKES:

- The present value with the 5% discount rate would be: $3/1.0251 + $3/1.0252 + $3/1.0253 + $103/1.0254 = $101.88
- Program your calculator to END & P/Y = 2
- [2ND][PMT]… you will see either END or BGN. If BGN, then [2ND][ENTER]… and you should see END which is what youwant.
- [2ND][I/Y]… you should see P/Y = ???… [2][ENTER].
- [4][N]… this represents the number of coupon payments
- [5][I/Y]… this represents the discount rate
- [3][PMT]… this represents the coupon payment
- [100][FV]… this represents the value at maturity
- [CPT][PV]… 101.88. This represents the current price that an investor would pay today in order to realize a yield to maturity of exactly 5%.
- The present value with the 8% discount rate would be: $3/1.041 + $3/1.042 + $3/1.043 + $103/1.044 = $96.36
PRESENT VALUE CONCEPTS
- KEY POINTS:
- If this were an annual pay bond, the cash flows would be $6 and $106 and the discount factors 1.051 and 1.052 or 1.081 and 1.082
- The higher the discount rate, the lower the present value of the bond
- If you are asked to calculate the PV of the coupons, then make the FV equal to zero
- If you are asked to calculate the PV of the principal, then make the PMT equal to zero
OTHER BOND YIELDS
There are three yield formulas that you are responsible for: T-bill yield, current yield, and yield to maturity


- T-bill yield: T-bills are issued at a discount and mature at par. The return that the investor makes is the difference between the discount and maturity value.
EXAMPLE: A T-bill is priced at 97.50 with 310 days to maturity. What is its yield?
(100 – 97.50)/97.50 x 365/310 x 100 = 3.02% - Current yield: This is the annual cash flow from an instrument, relative to the purchase price (necessary to receive that cash flow)
- Yield to maturity: Takes into account the annual cash flow from the bond, plus/minus the gains/losses received if the bond is purchased at a discount/premium. An approximate calculation takes:
(Interest income +/– Price Change per compounding period) x 100 / (Purchase price + Par Value) ÷ 2
If a bond has a 4% coupon, two years to maturity, and is priced at 101:
{[$4 – ($101 – $100)/2] / (100 + 101) ÷ 2} x 100= 3.48%
TERM STRUCTURE OF INTEREST RATES
- The graph that shows the time to maturity (along the “X” axis) and the required yield (along the “Y” axis) is known as the yield curve. The yield curve shows the required return, or yield, for a given class of bond in relation to its time to maturity
- NOMINAL RETURN = REAL RETURN + INFLATION
Bonds are quoted in the marketplace as per their nominal return; however what investors are most interested in is the bond’s real return. To determine this, investors must make their own assumptions about inflation - Two factors affect forecasts for the real interest rate:
- The real interest rate rises and falls through the business cycle, becoming lower during recessions and rising during the expansion phase
- An unexpected change in the inflation rate also affects the real interest rate – unexpectedly high inflation leads to lower real interest rates
EXPLANATIONS FOR THE YIELD CURVE
There are three theories that have been developed to explain the shape of the yield curve: Expectations Theory, Liquidity Preference Theory, and Market Segmentation Theory
- Expectations Theory – the slope of the yield curve reflects expectations about future interest rates. An upward sloping yield curve means that the market believes that interest rates will increase in the future; a downward sloping yield curve that interest rates will decrease in the future
- Liquidity Preference Theory – investors prefer liquid investments, and when a bond matures, it will convert into cash. Therefore, investors prefer short-term bonds and to get them to invest in long-term bonds, they must enjoy higher yields. According to this theory, an upward sloping yield curve reflects additional return for assuming additional (term) risk
- Market segmentation theory – the yield curve represents the supply and demand for bonds of various terms, primarily influenced by the bigger players in each sector. According to this theory, the yield curve can be any slope or shape
BOND PRICING PROPERTIES
- The stronger the borrower’s financial position and higher its credit rating, the lower the interest rate it has to pay investors for using their funds
- Long-term bonds are more volatile in price than short-term bonds. This is because there is a longer term over which the change in interest rates can affect the value of the bond
- Low coupon bonds are more volatile in price than high coupon bonds. This is because with low coupon bonds, the return of the investor is more dependent on the capital gain
- Special features like the callable or retractable or extendible or convertible features also impact the pricing of bonds
- The relative yield change is more important than the absolute yield change – a drop in yield from 12% to 10% will have less of an impact than a drop in yield from 4% to 2%
DURATION
- Bond prices have an inverse relationship to interest rates: An increase in interest rates leads to lower bond prices and a decrease in interest rates leads to higher bond prices
- Duration quantifies the relationship between bond prices and interest rates. Duration is a measure of the sensitivity of a bond’s price to changes in interest rates
- A bond with a duration of 5 implies the following: If interest rates increase by 1%, then the bond will fall in value by 5%. If interest rates decrease by 1%, then the bond will rise in value by 5%
EXAMPLE: A bond priced at 95 has a duration of 4. What is its price assuming that interest rates increase/decease by 1%? The bond’s change in price will be 95 x .04 = 3.80. Therefore, its new prices will be 91.20 (assuming higher interest rates) and 98.80 (assuming lower interest rates)
EXAMPLE: A bond priced at 102 has a duration of 6. What is its price assuming that interest rates increase/decrease by 1.5%? The bond’s change in prices will be 102 x .06 x 1.5 = 9.18. Therefore, its price would be 92.82 (higher) and 111.18 (lower)
EXAMPLE: A bond priced at 110 has a duration of 8. What is its price assuming that interest rates increase/decrease by 25 basis points (or ¼ of 1%)? The bond’s change in price will be 110 x .08 x .25 = 2.20. Therefore, its price would be 107.80 (higher) and 112.20 (lower)
HOW BOND MARKET TRADING WORKS
- Fixed income trading in the investment banking business is divided between two separate areas of operation – the sell side and the buy side
- Sell side is the investment dealer side. Sell-side institutions trade for their own accounts. Sell-side services include everything related to creating, producing, distributing, researching, marketing and trading fixed-income products
- Buy side is the investment management side. They are typically engaged buying and holding securities on behalf of their institutional clients. Most buy-side firms divide fixed income investment management duties into two primary occupational roles: Portfolio manager and trader
- Inter-dealer brokers act as agents, bringing together institutional buyers and sellers in matching trades. They perform similar functions to those of a market exchange
- All non-electronic trades are carried out over the telephone, and then a trade ticket or electronic confirmation is sent out which contains the following information: Specifics of the counterparties to the trade; identification of the bond; the bond’s CUSIP number; the par value of bond; price and often yield; settlement date; custodian’s name; and total settlement amount, sometimes with the amount of accrued interest shown separately
CLEARING AND SETTLEMENT
The settlement date of a trade is when the investor must pay for the security purchased.
- T-bills have same day settlement
- All other bonds and debentures settle on the second clearing day after the transaction takes place
- Bearer bonds – bonds where coupon payments are detached and treated like “cash”. The bearer is the rightful owner
- Registered bonds – bear the name of the rightful owner and can only be sold or transferred when the owner signs the back of the certificate
- Bonds today are issued in a book-based format with depository, trade clearing and settlement services provided by participating clearing providers
ACCRUED INTEREST
Bond owners can sell their bonds in between the payment or coupon dates. If they do so, the buyer of the bond must compensate the owner for interest not received – because the bond issuer promises to pay interest only twice a year
- Calculating accrued interest:
- Work out the two dates of the year that coupon payments are made. One is the day of the maturity date and the other is six months after that… e.g, January 15th and July 15th or February 1st and August 1st or March 10th and September 10th
- Work out the interest earned on a daily basis. This is the face value multiplied by the coupon rate divided by 365
- Count the number of days from the last coupon payment to the settlement date of the trade
- Multiply #2 by #3 – this is the accrued interest
EXAMPLE: A $250,000 face value bond with a 5% coupon matures October 1st, 2030. If the bond is priced at 102, what is the i) accrued interest and ii) total that the buyer of the bond would have to pay the seller of the bond, assuming the trade settles on June 5th?
- This bond pays interest on October 1st and April 1st.
- Daily interest: $250,000 x .05 divided by 365 = $34.25
- Number of days: 29 in April, 31 in May and 5 in June for a total of 65 days.
- Accrued interest: $34.25 x 65 = $2,226.25
i) $2,226.25
ii) $250,000 x 1.02 + $2,226.25 = $257,226.25
BOND INDEXES
Bond indexes are samples drawn from the bond market to provide investors with an indication of how the overall bond market is doing.
- Bond indexes are used in three ways:
- As a guide to performance of the overall market
- As a performance measurement tool to assess managers
- To construct bond index funds
- FTSE Global Debt Capital Markets offers a comprehensive set of Canadian bond issues. The best known is the FTSE Canada Universe Bond Index. The index consists of bonds representing a full cross-section of government and corporate bonds. Bonds in the index are grouped into sub-indexes according to whether they are government or corporate bonds, their time to maturity, and the bond rating
GLOBAL INDEXES
- Global bond indexes:
FTSE World Government Bond Index - U. S. bonds:
Bloomberg Barclays U. S. Aggregate Bond Index
FTSE US Broad Investment-Grade Bond Index - Government bonds:
FTSE UK Actuaries Gilts Index Series
S&P France Sovereign Inflation-Linked Bond Index - Emerging market bonds:
J. P. Morgan Emerging Markets Bond Index - High-yield bonds:
Credit Suisse High Yield Index
ICE Bank of America US High Yield Master II Total
Return Index
Author
shanghaizhangyijie@gmail.com
